Rendering isolated amenities vs dense regions
For a while I have been maintaining a slight fork of osm-carto. I changed a
few things here and there so I can use the map for several types of activities,
including driving. For that I set important highways (motorway to secondary) so
they stand out more using dark colors, but I also wanted to be able to spot
things that can be critical, like pharmacies, fuel stations and hospitals. Not
far from where I live there is a very mountainous regions
with a few small towns where not always there are these amenities.
The problem arises when you have to make a balance between a few icons on a sparse region and too many icons on a very dense one. Initially I started by adding smaller icons (10px instead of the usual 14px) and my first tests looked OK even on the most dense part of this region. But I had forgotten to check against really dense parts, like the biggest cities in Europe.
Long story short: The map becomes not only useless (too many icons) but also really ugly.
This is not the first time I try to do this, and back in January I got a glimpse of a possibility: I read in the weekly news about wikimap, which shows dots in a map for every geo-tagged wikipedia article. What got my attention is that the developer was using aggregated icons, so instead of showing a lot of them packed tightly, he's shown a big icon with a count of aggregated locations.
So I contacted him and asked him how he did it. He linked me to the code, but warned me that the post processing was really slow. Because of that I never really tried it.
But today, after looking at packed clusters of icons in cities like İstanbul, I decided to give it a go. The good part is that because I only need this for just a couple of amenities that can be concentrated enough to make the map ugly: pharmacies and fuel stations. Another advantage is that, unlike wikimap, I only need this for a single zoom level; the idea is to map those amenities in sparsely populated zones, assuming that in dense zones they should be common enough. So here's my first attempt:
CREATE MATERIALIZED VIEW IF NOT EXISTS density AS
    SELECT
        a.osm_id,
        (SELECT
            count(b)
        FROM
            planet_osm_point AS b
        WHERE
            ST_DWithin(a.way, b.way, 10000)
        AND a.amenity = b.amenity
        AND a.osm_id != b.osm_id) AS density
FROM
    planet_osm_point AS a
WHERE
    a.amenity = 'pharmacy';
We take a target (a.way) and we find all the similar objects within a radius
(10k EPSG:3857 meters, which is not actual meters except at the Equator) and
not counting itself. Then we use a cutout value to decide to render the node or
not:
[feature = 'amenity_pharmacy'][zoom >= 11][density < 15],
[feature = 'amenity_pharmacy'][zoom >= 14] {
Looking at the resulting data I found an interesting tidbit: Madrid has probably the higher pharmacy density in the world. Many nodes there have more than 1500 neighboring peers in a 10km radius!
This was not good enough. Initially I though the reason was that, instead of
density, I should look at minimum distance, replacing count(b) with
min(ST_Distance(b.way, a.way) and calling the table isolation, and define
a different cutout value.
The problem with that one is that if you have a two or more pharmacies close to
one another but otherwise isolated, I want to draw those. Instead, I reduced the
radius to 3km and played with the cutout value until I was satisfied.
A disadvantage of this approach is that now you have two values to play with, the radius and the cutout value, while the other one has only one. Not only that, every time you want to test a new radius value, you have to run an expensive query. For Europe, in my puny rig (10yo CPU, 8GiB of RAM, a consumer SSD on SATA) it can take around 30m, which is not specially expensive once you got the value you're happy with. Of course, I run my tests in smaller extracts.
Also, I don't run an up-to-date database, I simply reimport from time to time. If I did, the data in the materialized view (it's like a table, but remembers how it was calculated, and can be refreshed) would slowly become out-of-date, but one could live with that and run the refreshes, say, once a week.
Lastly, this mostly works for me because I have just a few 'popular' tags that I render so early (ZL11); for a generic map like OSM's default it would probably be way more expensive. Wikimap's developer told me that "it takes about 10 hours for the set of geotagged articles from the English Wikipedia."
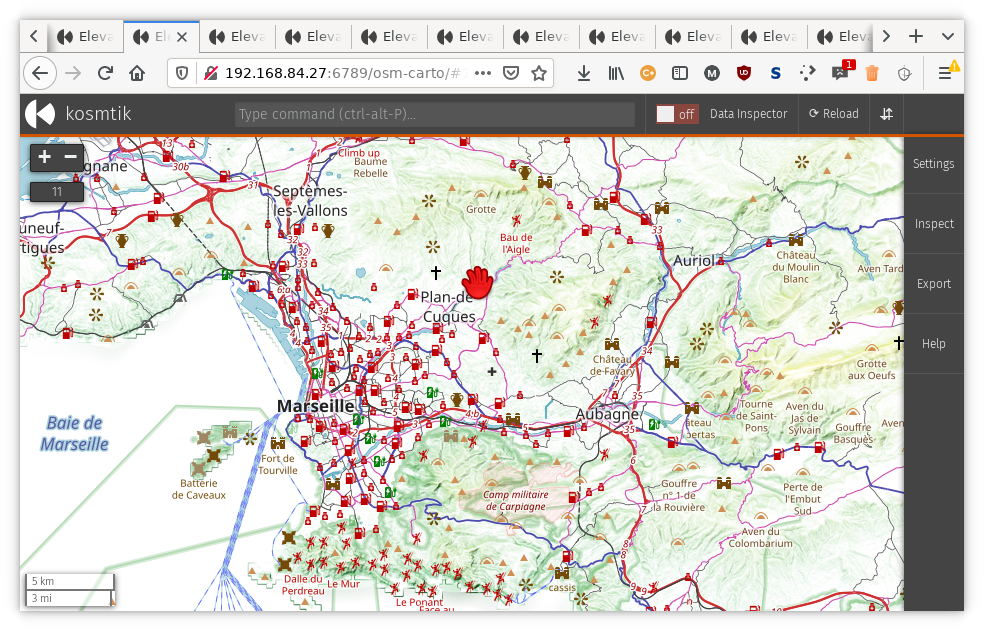
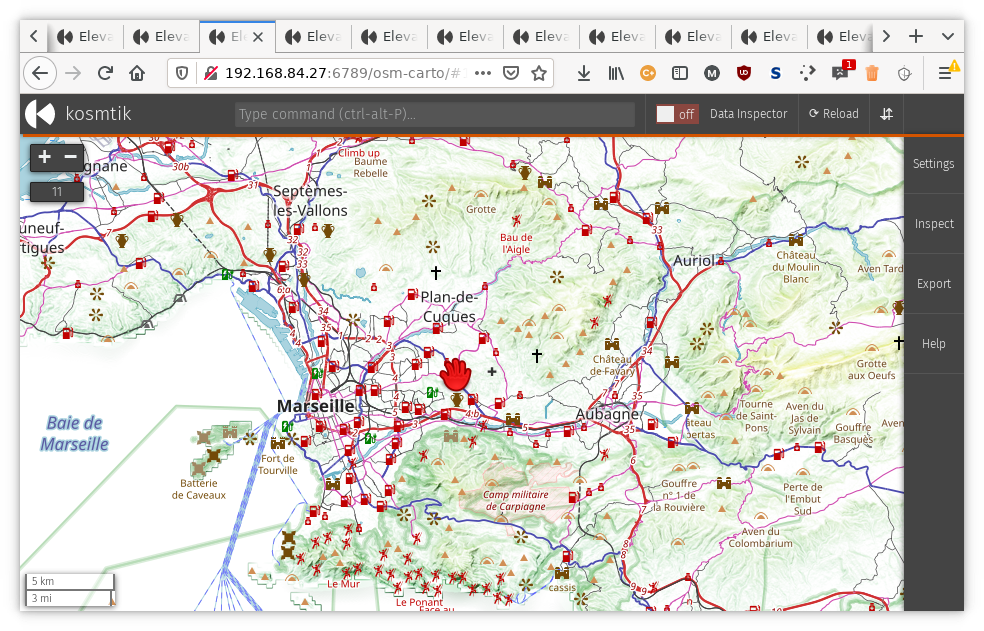
Finally, some screen shots:
Before:
After:
And, if you followed the link about Madrid, this is how it looks after.