Monitoring apache with prometheus and grafana
NE: this one is not going to be that coherent either, even when I'm actually writing it. Again, sorry for the mess.
Since nobody seems to have ever written a blog post about this beyond the basic 'explain + install + graph one metric in grafana', here's my take.
Analyzing Apache activity with tools like prometheus and grafana is not easy task, mostly because the kind of things that Apache can do is quite varied: it could be serving static files, of any size, receiving uploads, answering API calls, thin REST ones or big fat heavy ones, or even offloading SSL or just proxying to other services. So the first thing you have to ask yourself is: what does my Apache do?
In my case it's two things:
-
Serving static files, mostly map tiles and photos. These vary in size a lot: tiles are usually small, but I also have big 12MiB photos and at least 2 scaled down versions, the thumbnail and the gallery main image. These thumbnails and main image are generated from the originals and cached.
-
Serving a few services: webmail, rss reader and 'cloud' suit (file sharing, calendars, etc).
Second, you have to define what do you actually want to know about it. There are many options: What's my error rate? How long does it take to serve requests? What about queries whose payload can wildly vary in size? What about uploads?
You can also ask yourself about those values: Do I wan to know it in general, by any individual URL, by certain prefixes...?
These question should lead you to define certain things, including changes you might need to do to Apache. For instance, Apache's 'combined' log format include only status and written size (including headers), but neither read size, response time or time to first byte. TTFB is an important value to know for requests that either upload or download lots of data; for instance, in my case, the gallery's images. TTFB will tell you much time you spend before starting your answer. Even then, this value can be misleading, since there's nothing to prevent a framework or application to send headers as long as their values are calculated, but still have to much computation before actually sending the payload of the response.
# enable time to first byte
LogIOTrackTTFB ON

LogFormat "%h %l %u %t \"%r\" %>s %I %O %^FB %D \"%{Referer}i\" \"%{User-Agent}i\"" combined_io
So, where do we start about this? A good starting point is Brian Brazil's oldish post, where he mentions the Grok Exporter, but there is no version in Debian. This means, I need a binary release. Unfortunately, the GE seems to be abandoned by its original developer. The people at SysDigLabs maintain a fork, but they seem to have mostly focused on doing only maintenance around CI, dependencies, but no major code changes. None of the 11 pull requests or the 70 issues in the orignal repo seem to be addressed. I don't blame them, I'm just pointing it out. Besides, they're not providing binaries, except if you count a docker image as such.
So I decided to pick another fork. Of them all, a couple of them do provide binary releases, so I just picked one.
Meanwhile, I also thought that since I was already modifying Apache's log, I could do it in such a way that it would write CSV instead and use the CVS exporter. But since the GE is already there, some people seem to be using it, and this other one for some reason mentions SSH, I decided to stick to GE.
Ok, we install the GE, enable and start the systemd service. This involves extracting the zip, putting the binary and
the systemd service unit file somewhere, call systemd link so it sees the new service, write the configuration file and
place the pattern files you want in one of the pattern directories declare in the config file. Now what? Well, you can
say this is the fun part.
I decided to cut my monitoring by service. First to monitor was
my raster tile based map. I butchered the original patterns for
apache, splitting it into a prefix, a middle part that will match the path in the request, and a postfix that also adds
the three new fields. This way I can write a middle section for each service. Things could be different if I was serving
each one a different vhost. It also allowed me to capture parts of the path for instance to count served map tiles per zoom
level. This was easy once I figured I had to do the last step of the previous paragraph, otherwise
you get errors like Pattern %{IP:client_ip} not defined.
HTTPD_LOG_PREFIX %{IP:client_ip} %{HTTPDUSER:ident} %{HTTPDUSER:auth} \[%{HTTPDATE:timestamp}\]
HTTPD_LOG_POSTFIX %{NUMBER:status} (?:%{NUMBER:read}|-) (?:%{NUMBER:wrote}|-) (?:%{NUMBER:first_byte}|-) (?:%{NUMBER:total_time}|-) %{QS:referrer} %{QS:agent}

ELEVATION_LOG %{HTTPD_LOG_PREFIX} "(?:%{WORD:verb} /~mdione/Elevation/%{NUMBER:zoom_level}/%{NOTSPACE}(?: HTTP/%{NUMBER:http_version})?|%{DATA:rawrequest})" %{HTTPD_LOG_POSTFIX}
Have you noticed Apache's log have this ugly format for timestamps? 18/Nov/2023:23:44:13 +0100. Luckily we don't really
needed them, otherwise this would be a nighmare just to parse and convert to something we can use.
Now it's time to define the metrics. I wrote one metrics file per service. Since this is a static site, I built
histograms for response time and response size. Just for fun, I also wrote one for FTTB. This is quite straightforward,
except for one thing: defining the buckets. What I did was use awk to get the field I wanted, then sort -n and
less -N. I was looking at around 1000 requests, so I made buckets of around 100 requests. This value will not be so
easy to write for more wildly variant services. For instance, at $WORK we receive and send documents or bundles of
documents to be signed. The size of these PDFs and bundles of them are virtually unlimited, and in fact, we're starting
to experience issues where the servers freeze for up to 10m just chewing and digesting big uploads.
- type: histogram
  name: elevation_tile_ttfb
  help: Elevation tile Time-To-First-Byte
  match: '%{ELEVATION_LOG}'
  value: '{{multiply .first_byte 0.001}}'  # µs to ms
  buckets: [ 1, 10, 20, 30, 40, 50, 75, 100, 150 ]

- type: counter
  name: elevation_tile_zoom_level_count
  help: Counts tiles per zoom level
  match: '%{ELEVATION_LOG}'
  labels:
    zoom_level: '{{.zoom_level}}'
Last step of the chain, and quite frankly, the one that took me more time: having a nice graph in grafana. My grafana
version is somewhat old (6.7.2 v 10.2.1!1), so my only option is a heatmap panel. One thing to know about the grok
exporter's metrics is that they're counters, so the first thing you have to do is to use increase() to get the
derivative. I took me quite a long time to find out this (no, I can't say I figure it out, I read it
here). Second, Grafana by
default assumes it has to massage the data to build the heat map, so you have to tell it that the data is already a
histogram. In the same vein, you also have to tell it a second time you want a heatmap, this time as the query's
format. I also hid zero values and made the tooltip a histogram. Play around with the rest of the settings.
{
  "type": "heatmap",
  "targets": [
    {
      "expr": "increase(gallery_ttfb_bucket[1m])",
      "legendFormat": "{{le}}",
  "format": "heatmap"
}
  ],
  "heatmap": {},
  "dataFormat": "tsbuckets",
  "yAxis": {
    "format": "ms",
  },
  "tooltip": {
    "show": true,
    "showHistogram": true
  },
  "hideZeroBuckets": true
}
Here's the Gallery's dashboard:
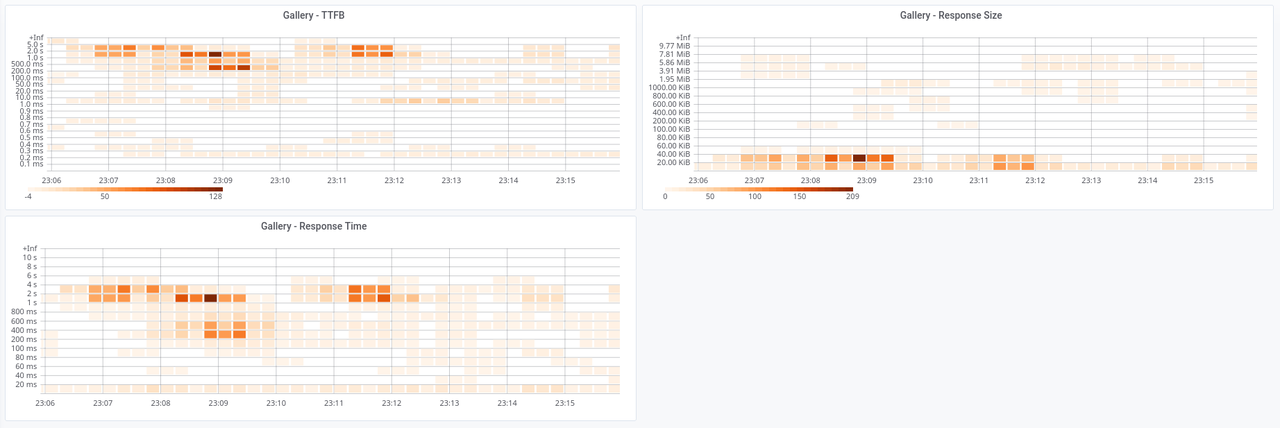
It's me traversing my gallery. The first part is me getting into a directory that has never been seen, so the gallery had to generate all the thumbnails. That's why we're seeing TTFBs and RTs so high, but the sizes stay low, because they're all thumbnails. Then it's me poking around here and there, most of the time seing the thumbnail table, but sometimes navigating the photos one by one in their big version. No original version was downloaded. I think I'll have to let these run for a while an revisit the buckets. The one for the response size already needs an adjustment. Also notice that my home server is quite boring, I have to do synthetic usage just to have values to graph.
One thing to notice here. Not once in this post I mention the word latency, even when it's one of the buzzwords around web services. About that I strongly suggest you to watch Gil Tene's How NOT to measure latency talk. It's an oldie, but man it packs a lot of info, including demystifying quantiles and nines.
Update
Today I noticed that an anternative to the Grok Exporter is mtail. It has the
advantages that it's well maintained and already available in Debian, but on the other hand you have to program it.
I'll stick to GE until a reason raises to switch to it.
Also:
- Slight additions and clarifications.
- Fixed typos and removed dupes.
-
This was because I was using grafana from Debian and not their repository. ↩