Monitoring servers with prometheus and Firefox tabs
I suddenly found myself with a lot of time in my hands, so I decided to play with my home lab, which I hadn't been able to for ages. First stop is monitoring. I already had Prometheus and Grafana installed, with a few dashboards and panels running. I also had Munin, which is an old school, mostly static monitoring system, but which, at least in Debian, has a lot of scrapers builtin. Debian's postinstall script checks your system and enables all the relevant ones, so you get a lot of 'panels' out of the box. The plan was to try to mimic some of Munin graphs with Prometheus and Grafana.
I first attacked one of the most complex ones, which is the memory graph, with 13 metrics on it. All the data comes directly
from the node exporter, and most lines are just picking a metric. The only calculated values are swap usage
(node_memory_SwapTotal_bytes - node_memory_SwapFree_bytes) and app usage
(node_memory_MemTotal_bytes - node_memory_Buffers_bytes - node_memory_Cached_bytes - node_memory_Shmem_bytes - node_memory_PageTables_bytes - node_memory_Slab_bytes - node_memory_MemFree_bytes).
Graph wise you have to stack the metrics, except active, inactive, commited and mapped, and put swap on the top, so they
all add up to the available RAM and swap becomes like a 'crest' on top. See how beautiful it is:
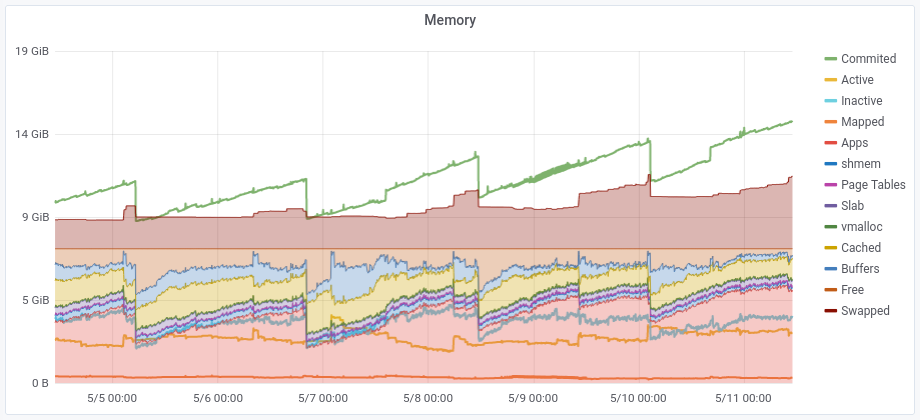
The first thing I notice is that sawtooth figure, the classical look of a memory leak, so it's time to go deeper. A tool
like htop might give you a clue, but as it's always showing the current status, you can't see trends. On the Prometheus
side there's the process exporter, so I installed that; Munin doesn't have anything like it, so you'll have to
search for one, but it would probably be shorter to write your own. I configured the PE to monitor all processes (there are
only ~250 running at a time), using the process name and PID as name (name: "{{.Comm}}-{{.PID}}"). Then I fire up a
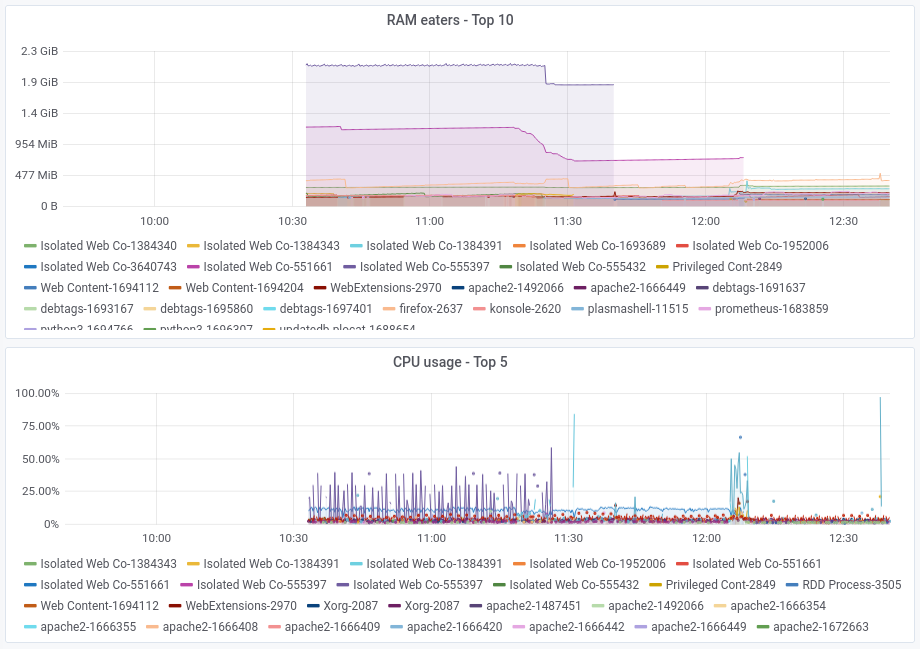
new panel that graphs topk(10, namedprocess_namegroup_memory_bytes{memtype="resident"}), the top 10 RAM eaters.
And sure enough, 2 Firefox subprocesses are the top culprits. This machine is both my home server and the media center, and being a single parent now means that the kids watch TV while I do the chores (cooking, mostly; the rest are done when they're sleeping). So, Firefox is always up with 2 or 3 tabs (among the usual loitering tabs one always has around waiting to be read, which almost never happens) where they watch their favorite content. Maybe these tabs are constantly accumulating data from the sites, and maybe at some point Firefox is reaping them because they're taking too much RAM. To test the theory, I closed one of the tabs, but instead of one of those processes disappearing as I expected, one just reduced considerably its resident size.
I waited a while, closed a second one, an the process disappeared from the top 10, meaning it went from 1.9GiB to less than 105MiB of resident size! I'm not going to name the culprit, suffice to say it's a streaming service with an Irish name. I had also setup a Top 5 CPU users, and sure enough, by the time I closed this second tab, its CPU usage went from a jumpy 3-50% to a stable 3%. So far so good!
But there was a second Firefox process using RAM and CPU. Which tab could this be? There were still a couple of tabs
with often used streaming services open, but can we try to investigate which ones are tied to this process? Looking
around I found about
about:processes instead,
which is not exactly what I was looking for, but it was good enough to figure out that it was not a streaming site but a
news one. Again no names, I'm just going to say it's a sibling of the site that went bankrupt over a sex tape. It was a
good thing I tried to get the facts right instead of trying to close tabs blindly!
Unluckily, there doesn't seem to be a way to get this info from outside Firefox, so for now I'll just have to be conscious about the tabs that are left open. This is how these two graphs look now: