Finding data peaks with grafana and prometheus
While doing my research for the OSM import and update posts I used one of the simplest graphs I have in my Grafana
instance: disk usage. Because the source is Prometheus' node_exporter's node_filesystem_* series, I have to use an
expression:
node_filesystem_size_bytes - node_filesystem_free_bytes
In the same graph I also have just node_filesystem_size_bytes drawn as a dotted line to see what's the limit of each
disk (this system has only two for the moment). But for the investigation itself I also wanted to know the peak of the
data usage, and in particular when it happened. So my train of thought was this:
“I just need to take the max() of the data.”
Wrong. max() is an
aggregator operator
(yes, not a function; I thought it was one, as many examples use parenthesis) and does not do what I want. If you graph
that, you only get the same line as the max of all the graphed series, which, in retrospective, makes sense.
So I try around more stuff and I can't get it done. As in many other cases, I head over to #prometheus@libera.chat for
answers. The first part of the solution is max_over_time(), which is
a function (yes this time)
that takes a range vector and produces an instant vector. Now, I want to see the max over the graphed range, which will
change as I zoom in and out in Grafana looking at different parts of the process, not the max over the whole series or
some other fixed number, so I'll be using Grafana's $__range variable. So this must be it:
max_over_time((node_filesystem_size_bytes - node_filesystem_free_bytes)[$__range])
Right?
Wrong, again. parse error: ranges only allowed for vector selectors.
sigh
I cheated again and got the answer from the IRC channel. The answer is subqueries:
max_over_time((node_filesystem_size_bytes - node_filesystem_free_bytes)[$__range:])
Spot the difference, I challenge you.
Let's take a step back.
To start with, I realized something that is quite subtle here. If you read the documentation closely, it talks not only
about instant and range vectors, but also about instant and range vector selectors. In my head, as a programmer, I
now have to think of them in terms of foo being a IVS that 'returns' and IV; if you add a range, as in foo[1m], you
get a RVS that 'returns' an RV1.
Then, as this video mentions, binary operators return mostly IVs, and that's why you can't apply a range to them, because they're not selectors, but final values.
But.
The subquery syntax2, among other things, allows you to 'apply a range' to your IV and get a RV. One slight difference is that on a RVS you might get different amount of data point across series, while with a subquery, I think, the IVS in the subquery is evaluated for every period, so you always get a value for each time. I don't have an example without data, but if you run a subquery, you'll see all the timestamps don't have a decimal digits (they're integers) because they align with the scrapping period (15s):
node_filesystem_free_bytes[1m]
------------------------------
node_filesystem_free_bytes{device="/dev/sda2",fstype="ext4",instance="127.0.0.1:9100",job="node",mountpoint="/"}
    217540681728 @1692981943.193
    217540648960 @1692981958.194
    217540624384 @1692981973.193
    217540595712 @1692981988.193
[...]
vs
node_filesystem_free_bytes[1m:]
-------------------------------
node_filesystem_free_bytes{device="/dev/sda2",fstype="ext4",instance="127.0.0.1:9100",job="node",mountpoint="/"}
    217540513792 @1692982035
    217540476928 @1692982050
    217540448256 @1692982065
    217540423680 @1692982080
[...]
Again, spot the difference. Go ahead.
So for now part of the solution feels like a black box. I hope one day understand all this, but for now this will have to be enough.
But I haven't finished.
That query only gives you an instant vector. If you graph that, you also get a line following the original data! The tricks are:
- Tell Grafana to do an 'instant query'.
This makes Grafana get a single value, not a value per graph period.
- Tell Grafana to extend the graph by using a series override and apply "Transform: Constant".
This makes that single dot per series a line.
The final graph:
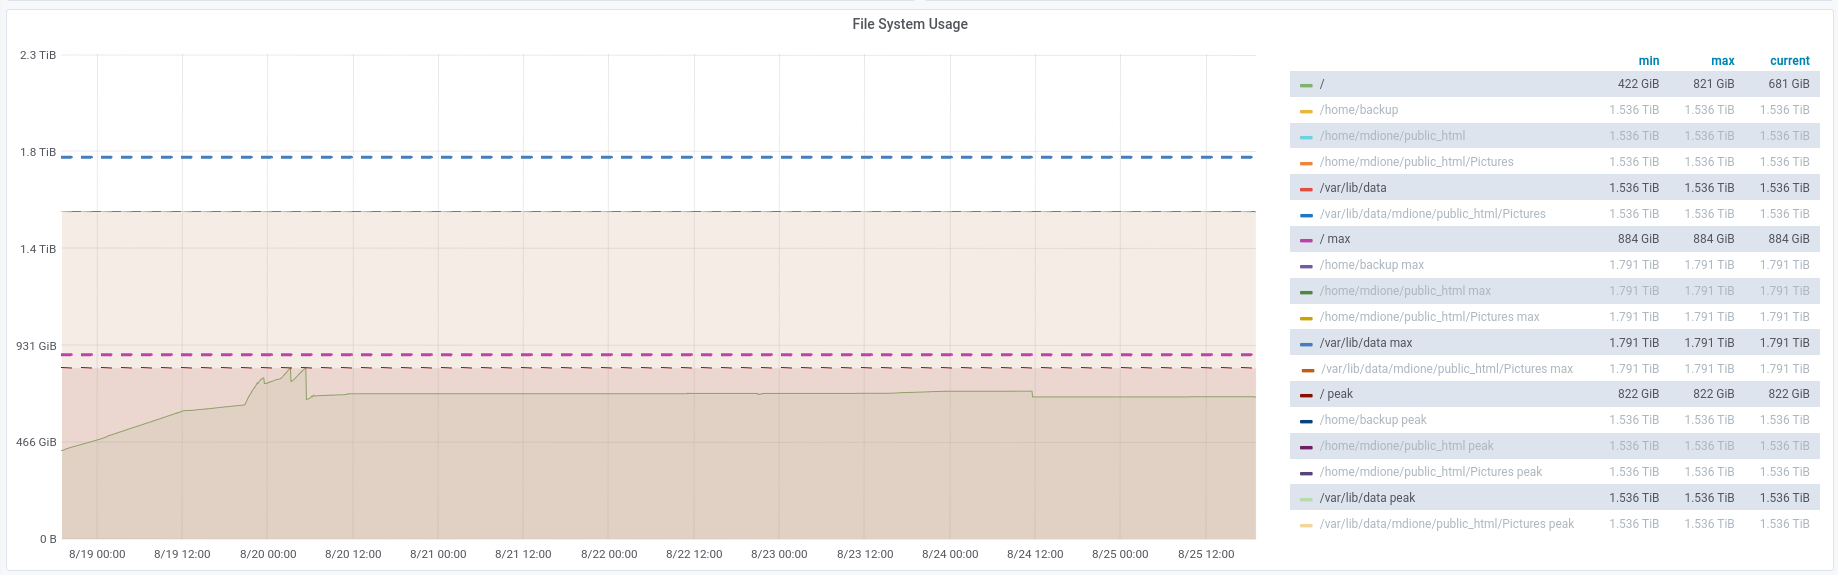
You can see the import peaks at the left. Disk capacity is drawn with thick dashes. The other disk's usage didn't change in all that time, so there's no peak and the max line follows the graph.
-
At the beginning I thought the problem was that expression values were not instant vectors. They seemed to be something else, and you that couldn't range them. The alternative is to create a recording rule, which is a calculated (from an expression) data series, from which you can get ranges because you can use an IVS to reference them. ↩
-
Good luck trying to get something useful from that. Try this one instead. ↩