Monitoring Apache with SQL and Grafana
Ever since my last job I have been wanting to make this. I think it's not the first time I do it, but for one reason or another, I did it (again?) in two evenings only.
In that job we had an internet facing API with Apache as the router in front of several services. All
our metrics and even our billing was based on the Apache logs. We had a system that ingested the logs
into a PostgreSQL database, and we tried to create Grafana panels and alerts based on that info. At
the same time, I wanted to reproduce awstats in Grafana, and found it was
almost impossible.
Another problem is that the usual tools to solve this, Loki or Prometheus, have big problems to handle this
type of too arbitrary data (think of the referer or user_agent columns) or whose space is too big
(client is an IPv4, with 4Bi different values). They effectively suffer (in principle) of what they
call "cardinality bomb": since they build one time series database (TSDB) per combination of fields
(they call them "labels"), storage use is big and aggregation operations inter TSDBs are expensive.
Last night I sat down to reimplement the ingestion side. Instead of PostgreSQL I used SQLite mostly
because almost all of my services (with low traffic and mostly only me as user) already use it. To be fair,
and one really can't expect anything else, the script is quite straight forward. It uses regexps to
parse the logs, which for the moment is good enough. I'm "releasing" it as is, because I'm tired, but you'll
find some surprises around parsing the request line (see request_re and its handling); some janky ways
to convert from str to int or datetime; and an iteration trick to use dataclasses as execute()
argument. I omited some comments and all the testing:
#! /usr/bin/env python3

from dataclasses import dataclass
from datetime import datetime, timedelta, timezone, tzinfo
import pathlib
import re
import sqlite3
import sys

# I miss dinant

# no 0-255 range check since this is written by apache
# if the number is not in that range, we have bigger problems
octet_re = r'\d{1,3}'
ip_re = r'\.'.join([ octet_re ] * 4)

word_re = r'[^ ]+'
identd_user_re = word_re  # it can be '-'
user_id_re = word_re      # it can be '-'

month_names = [ 'Jan', 'Feb', 'Mar', 'Apr', 'May', 'Jun', 'Jul', 'Aug', 'Sep', 'Oct', 'Nov', 'Dec' ]

day_re = r'\d{1,2}'
month_re = f"(?:{'|'.join(month_names)})"
year_re = r'\d{4}'
date_re = f"({day_re})/({month_re})/({year_re})"

time_re = r'(\d{2}):(\d{2}):(\d{2})'

utc_offset_re = r'(?:\+|\-)\d{4}'  # no capture

# fscking double escaping :(
date_time_re = f"\\[{date_re}:{time_re} ({utc_offset_re})\\]"

method_re = word_re
url_re = word_re  # technically not a word, but word_re is too generic

proto_re = r'HTTP'      # who are we kidding
version_re = r'\d\.\d'  # who are we kidding
proto_and_version_re = f"({proto_re})/({version_re})"

# idiot skrip kidz send no method or proto/version!
# and re is silly? enough to produce empty matches for the ()s here
# oh, but re.compile().match().groups() returns things like
# (None, None, None, None, '', '\\x16\\x03\\x02\\x01o\\x01', '', '')
# so we gained nothing
request_re = f'"(?:({method_re}) ({url_re}) {proto_and_version_re}|()({url_re})()())"'

number_re = r'\d+'

http_status_re = number_re
bytes_rx_re = number_re
bytes_tx_re = number_re
ttfb_re = f"(?:{number_re}|-)"
response_time_re = number_re

double_quoted_text_re = r'"([^"]+)"'
referer_re = double_quoted_text_re
user_agent_re = double_quoted_text_re

log_line_re = re.compile(f"^({ip_re}) ({identd_user_re}) ({user_id_re}) {date_time_re} {request_re} ({http_status_re}) ({bytes_rx_re}) ({bytes_tx_re}) ({ttfb_re}) ({response_time_re}) {referer_re} {user_agent_re}$")


@dataclass
class LogRecord:
    client_ip: str         # 0
    indent_user: str
    user_id: str
    date_time: datetime
    method: str
    url: str               # 5
    protocol: str
    protocol_version: str  # could be float, but we don't really care; besides, x.y.z?
    status: int
    bytes_rx: int
    bytes_tx: int          # 10
    ttfb: int  # maybe -!
    response_time: int
    referer: str
    user_agent: str

    @classmethod
    def from_log_line(cls, line):
        match = log_line_re.match(line)

        if match is None:
            raise ValueError(f"Malformed line: {line.strip()}")

        data = list(match.groups())
        new_data = []

        group_index = 0
        for field_index, (name, field) in enumerate(cls.__dataclass_fields__.items()):
            if field.type == datetime:
                # [11/May/2026:20:15:28 +0200]

                # convert month str to number
                data[group_index+1] = month_names.index(data[group_index+1]) + 1

                # convert to ints
                data[group_index:group_index+6] = [ int(x) for x in data[group_index:group_index+6] ]

                new_data.append( datetime(data[group_index+2], data[group_index+1], data[group_index],
                                          data[group_index+3], data[group_index+4], data[group_index+5], 0,
                                          utc_offset2tzinfo(data[group_index+6])) )

                group_index += 7

                continue

            # handle ttfb as -
            if field_index == 11 and data[group_index] == '-':
                #
                data[group_index] = data[group_index+1]

            if data[group_index:group_index+4] == [ None, None, None, None ]:
                if group_index in (10, 14):
                    # handle (None, None, None, None, '', '\\x16\\x03\\x02\\x01o\\x01', '', '')
                    # handle ('GET', '/', 'HTTP', '1.0', None, None, None, None)

                    # no need to add anything, it's handled by the fallback
                    # but we still need to skip this cruft
                    group_index += 4
                else:
                    raise ValueError(f"Got confused: {(field_index, field.type, group_index, data[group_index], new_data)}")

            # convert ints
            if field.type == int:
                data[group_index] = int(data[group_index])

            # fallback
            new_data.append(data[group_index])
            group_index += 1

        return cls(*new_data)


    # implement the iterator protocol so we can mostly be passed as argument to execute()
    def __iter__(self):
        return self


    def __iter__(self):
        for value in self.__dict__.values():
            # the whole protocol could be replaced with .__dataclass_fields__.values() :shrug:
            # but this way I can do further conversions
            if type(value) == datetime:
                value = int(value.timestamp())

            yield value


def utc_offset2tzinfo(offset: str) -> tzinfo:
    # +0200
    hours = int(offset[:3])    # +02
    minutes = int(offset[3:])  # 00

    return timezone(timedelta(hours=hours, minutes=minutes), offset)


def connect():
    # if we test after sqlite3.connect(), the file is already created
    create = not pathlib.Path('./apache_logs.db').exists()

    conn = sqlite3.connect('./apache_logs.db')

    if create:
        conn.cursor().execute('''
CREATE TABLE "logs" (
    "client"    TEXT,
    "indent_user"   TEXT,
    "user_id"   TEXT,
    "timestamp" INTEGER,
    "method"    TEXT,
    "url"   TEXT,
    "protocol"  TEXT,
    "protocol_version"  TEXT,
    "status"    INTEGER,
    "bytes_rx"  INTEGER,
    "bytes_tx"  INTEGER,
    "ttfb"  INTEGER,
    "response_time" INTEGER,
    "referer"   TEXT,
    "user_agent"    TEXT
);''')

    return conn


def main():
    conn = connect()
    cursor = conn.cursor()

    for line in sys.stdin:
        try:
            log_record = LogRecord.from_log_line(line)
        except ValueError as e:
            print(e.args[0])
            continue

        cursor.execute('''INSERT INTO logs VALUES (?, ?, ?, ?, ?, ?, ?, ?, ?, ?, ?, ?, ?, ?, ?)''',
                       tuple(log_record))
        conn.commit()


if __name__ == '__main__':
    main()
One of the things I didn't do was to further play with the URLs. One could make list of different apps based on whether there is any routing to different services, like in the cases of my previous job and my own server; or even different subdivisions on a single app, like for NextCloud:
ocs/v2.php/apps/serverinfo
remote.php/dav/files/USER
remote.php/dav/calendars/USER/CALENDAR/
etc. I haven't really thought about it; it could be implemented either as more columns or extra tables.
Today I managed to finish the rest.
The next step is to install this so it runs constantly with the output of tail --follow=name --retry
piped into its stdin1. Left as an exercise for the reader; use SystemD units :)
Next is installing Grafana's plugin to read SQLite and declare the new Grafana datasource.
The hard part was to query the data in a way that was useful for Grafana. I managed to get a query like:
-- round to the minute
SELECT timestamp/60*60 AS time, status, COUNT(status) as "count"
FROM logs
-- $__from and $__to are defined by Grafana based on the dashboards's time range
WHERE timestamp >= $__from / 1000 and timestamp < $__to / 1000
GROUP BY timestamp/60, status
to get the count of different status codes per minute2. But this returns a table that looks like:
      time | status | count
1778533620 |    200 |    30
1778533620 |    207 |     3
1778533620 |    403 |     1
while Grafana is expecting one line per sample (but remember we're aggregating data) and one column per data series:
      time | 200 | 207 | 403
1778533620 |  30 |   3 |   1
I read how to pivot this in SQL, but it mostly works only if you know the different values for the
status column beforehand. This might be feasible with
HTTP status codes (I count
63 standard ones, including the joke 418 I'm a teapot), but that would be impossible for the referer
or user_agent columns.
Thanks to iRobbery#postgresql@libera.chat I found about
Grafana's Partition by values data transformation.
Aplying it to the column that defines the time series (status, etc), it gives us exactly what we want!
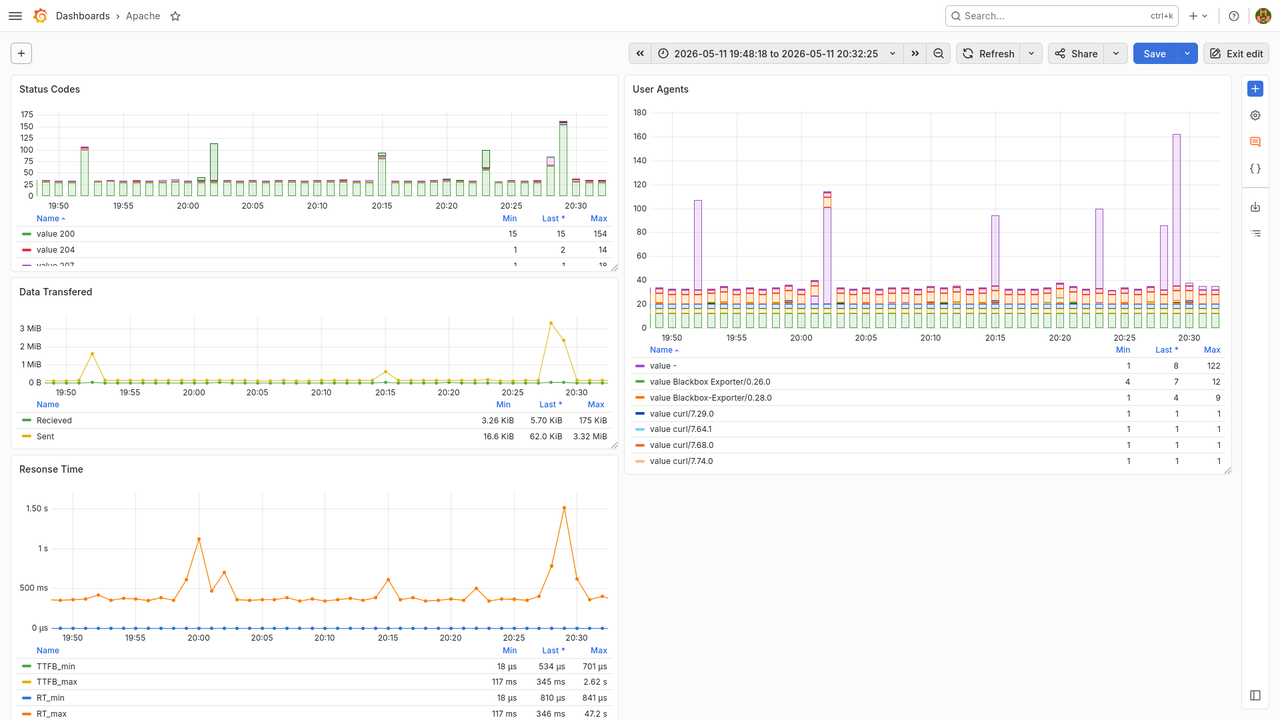
And one can even include a pure table with all the logs to inspect when one finds weird spikes or values. I made almost impossible queries like transferred bytes per URL, methods per client and more! One missing piece, i possible, would be to implement histograms, like last time we looked into this.
-
One could cite the UNIX philosophy, but seriously, who wants to reimplement all the corner cases of that
tailinvocation? See for instance the 113 bugs found in the coreutils Rust reimplementaiton ↩ -
One could use a dashboard variable to control this arbitrarily. One could get granularity per second! ↩